Abstract
Introduction:
Virus-specific humoral and cellular immune responses act synergistically to protect from viral infection. In our recent observational monocentric study of 117 hematopoietic stem cell adult recipients, we found that 54% and 83 % patients achieved a humoral response after two doses of BNT162b2 anti-SARS-CoV-2 messenger RNA vaccine (Pfizer BioNTech), respectively. Here, we evaluated the T-cell response against the SARS-Cov-2 spike protein after two doses of BNT162b2 vaccine in some allografted patients from the same cohort and compared these results to those from healthy controls.
Methods:
To quantify SARS-CoV-2 specific T-cells, we used an INFg ELISpot assay that detects these cells after activation of peripheral blood mononuclear cells (PBMC) with 3 peptide pools covering the whole protein sequence of the spike glycoprotein (Prot _S1; _S+ and _S PepTivator peptide pools, Miltenyi Biotec, Bergisch Gladbach, Germany). EBV and CMV specific T-cells were also quantified as controls. The immunophenotype of PBMC was determined by flow cytometry, after dead cell exclusion, with monoclonal antibodies identifying the following surface antigens: CD45, CD3, CD14, CD19 and HLA-DR. The frequencies of spot-forming units (SFU) were reported as per 10 6 CD3+ T-cells.
Results:
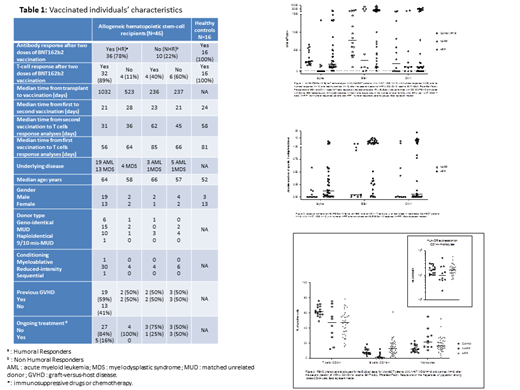
Samples from 46 allografted patients (acute myeloblastic leukemia, N=27, myelodysplastic syndrome, N=19) and 16 healthy controls were available. Characteristics of the population are given in Table 1. All fully vaccinated healthy donors became seropositive and developed a positive T-cell response to spike peptide pools even though variable frequencies were observed. The median response was 195 SFU/10 6 T-cells. By comparison, the frequency of EBV-specific T-cells was 774 SFU/10 6 T-cells (Figure 1).
In the group of patients, 78% (n=36/46) had achieved a humoral response after the second dose of vaccine. Among these humoral responders (HR), 89% (n=32/36) also had a positive anti-spike T-cell response with variable frequencies (median =119 SFU/10 6 T-cells. For 8 patients, this T cell response was higher than that of controls (>800 SFU/10 6 T-cells) (Figure 1), which is equivalent to more than 1 specific T-cell per microliter of blood (Figure 2). The humoral responders (HR) who did not develop a T-cell response (11%, n=4/36) had a median time from transplant to vaccination of 523 days compared to 1032 days for cellular responder patients.
Among the 10 patients who were non humoral responders (NHR) (22%, n=10/46), 4 (40%) developed a cellular immunity, including one with a very high T cell response (1333 SFU/10 6 T-cells). As expected, the absence of humoral response was observed in patients who were within one year of the transplant.
Of note, somehow unexpectedly, patients often presented a high frequency of EBV- and CMV-specific T cells (Figures 1 & 2).
As expected, PBMC immunophenotypic analysis revealed that CD3+ frequencies were lower in patients compared to those of controls but were similar between HR and NHR. NHR had very low frequencies of B cells and interestingly, they had an elevated frequency of CD14+ monocytes with low/neg HLA-DR expression potentially corresponding to myeloid-derived suppressor cells (MDSCs) (Figure 3).
Conclusion:
In this series, 89% of allografted patients who developed an anti-spike humoral response also presented an anti-SARS-Cov-2 cellular immunity. Interestingly, anti-SARS-Cov-2 specific T-cells could be detected in 40% of NHR patients. Although a larger group of patients is required to confirm these results, it remains to be determined whether this T-cell response is protective against SARS-Cov-2 infection as previously demonstrated for CMV (Litjens et al, 2017). Finally, the role of potential immunosuppressive MDSCs must be explored in patients who develop no sign of T-cell response after vaccination.
Moreau: Oncopeptides: Honoraria; Celgene BMS: Honoraria; Sanofi: Honoraria; Abbvie: Honoraria; Janssen: Honoraria; Amgen: Honoraria.


This feature is available to Subscribers Only
Sign In or Create an Account Close Modal